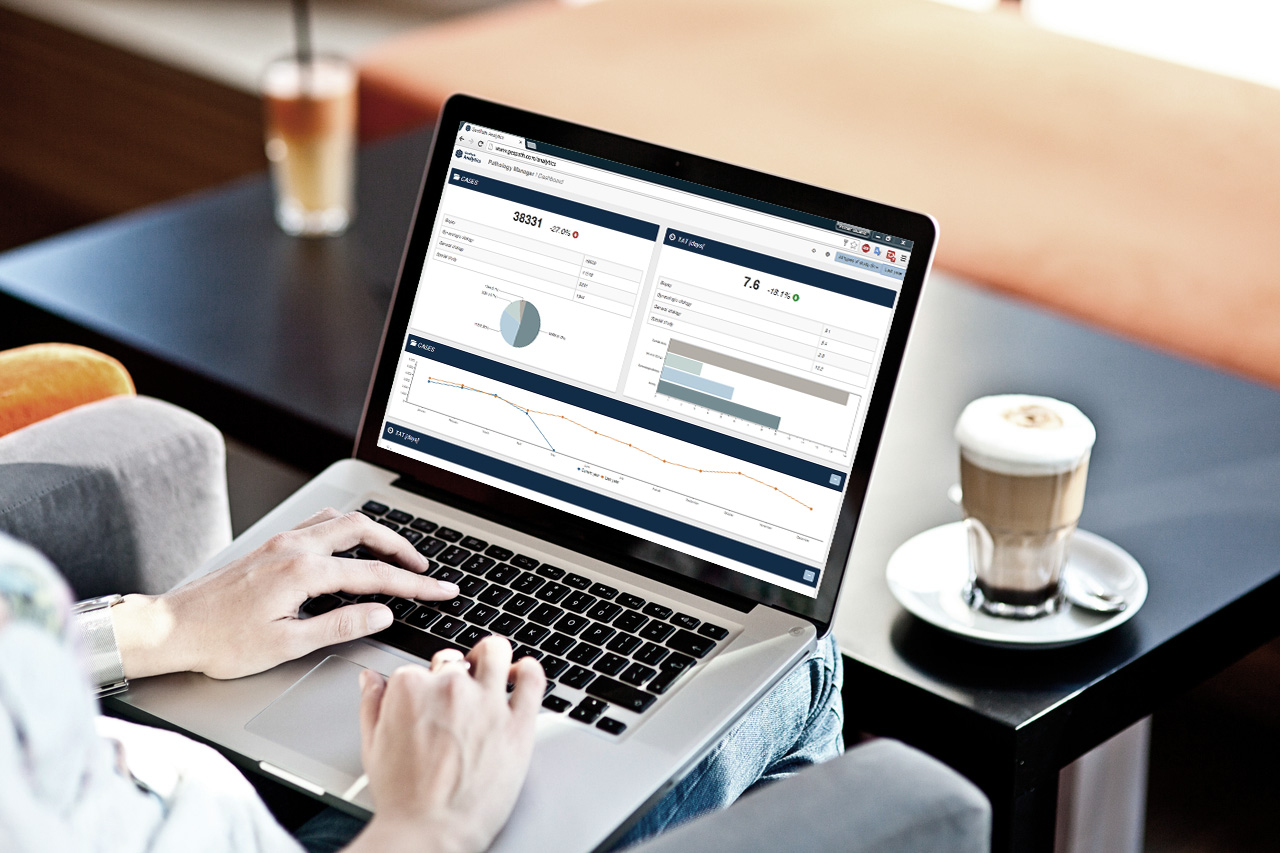
Access personalized insights to optimize turnaround times, monitor activity in real time, and balance your department’s workload.
Everything you need to manage your laboratory with real data
Answers to key management questions
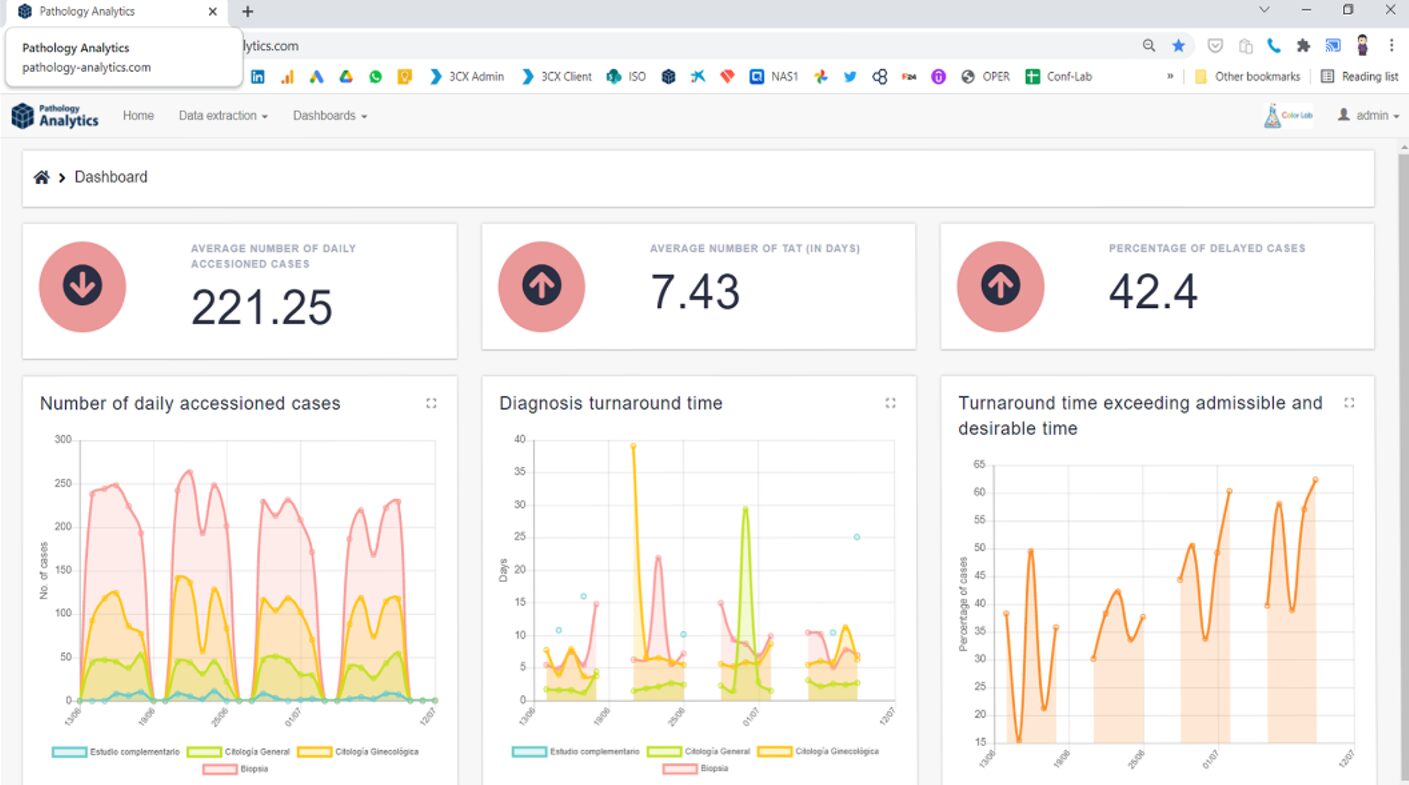
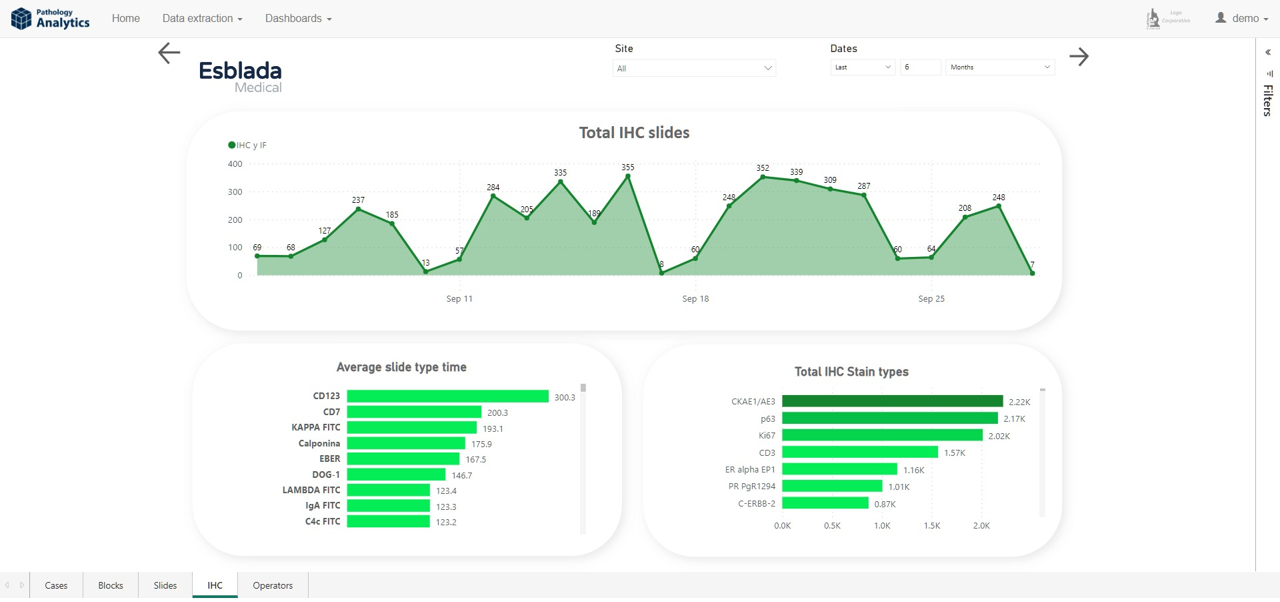
Service activity can be analyzed by period, specialty, type of study, workflow, or referring center.
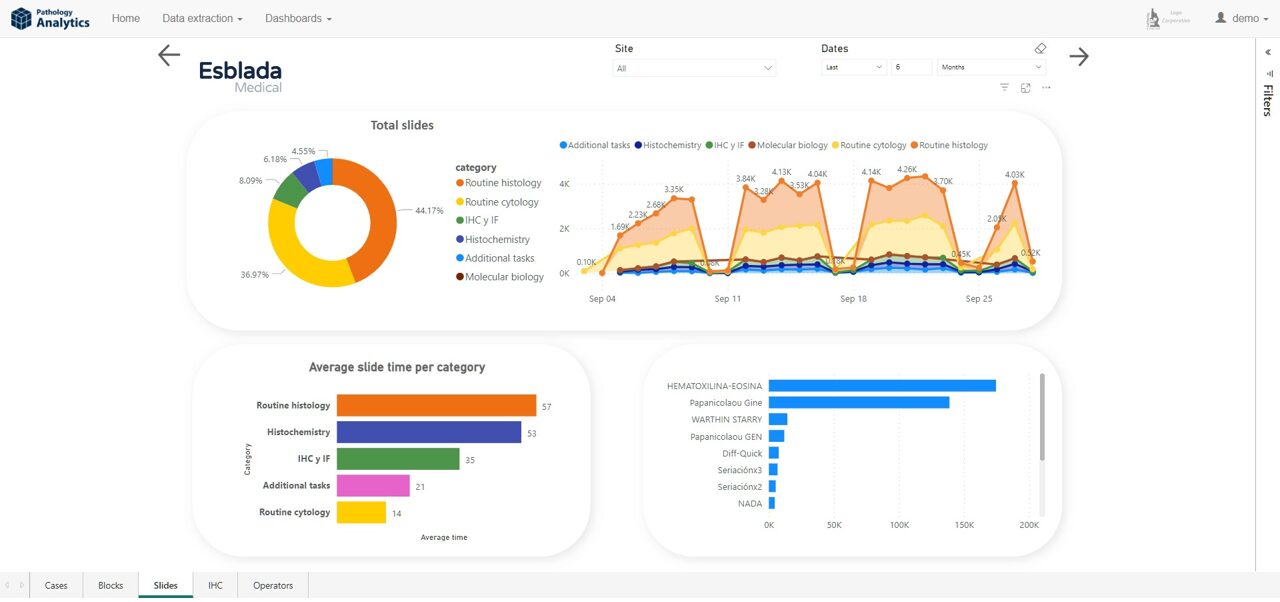
Dashboards make it easy to pinpoint bottlenecks, recurring delays, and overload in specific areas or processes.
Information is presented in a centralized, structured way, avoiding data fragmentation across multiple files or systems.
The architecture is designed to work with years of historical data while maintaining response times suited to daily analysis.